


 8 / 38

[08]
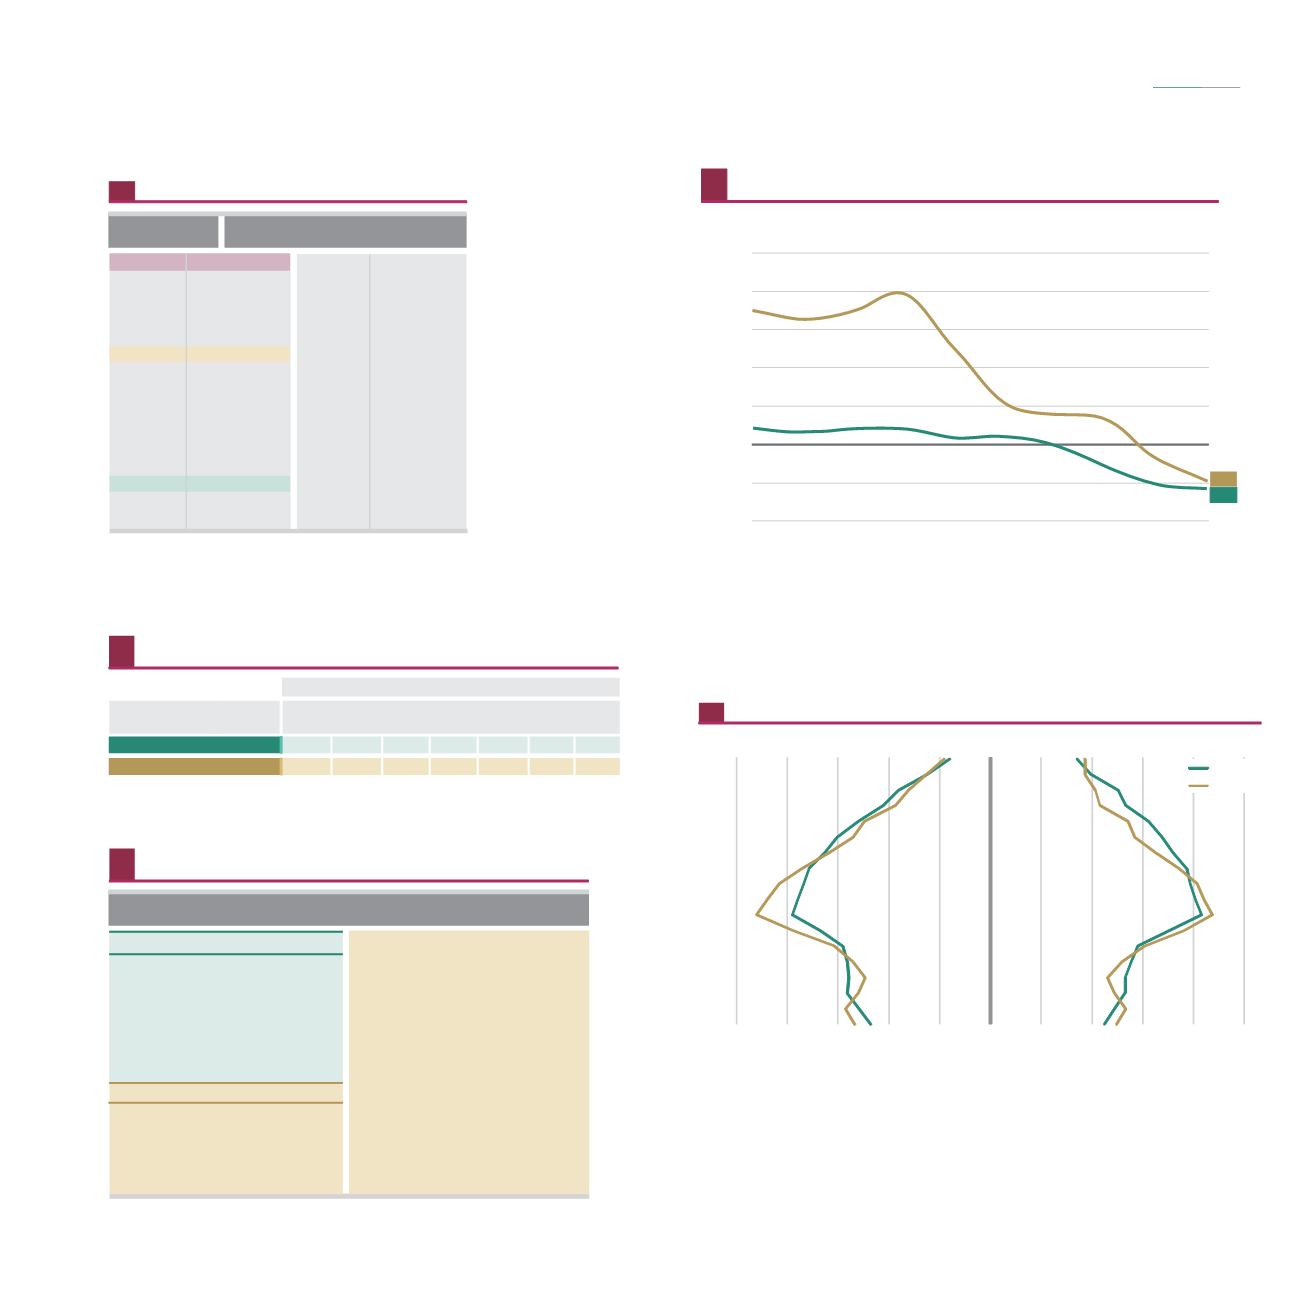
Taxa de crescimento efetivo, 2004-2013
Crude rate of population change (1000 inhab.), 2004-2013
10
Population
População
2014
1 000 hab./inhab.
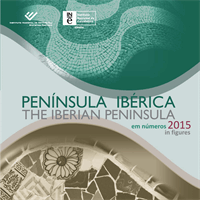
População, 1 de janeiro de 2014
/
Population on 1 January 2014
UE/EU 28
ES
PT
DE
FR
UK
IT
PL
RO
NL
BE
EL
CZ
HU
SE
506 825
46 512
10 427
80 767
65 836
64 308
60 783
38 018
19 947
16 829
11 204
10 904
10 512
9 877
9 645
AT
BG
DK
Fi
Sk
IE
HR
LT
SI
LV
EE
CY
LU
MT
8 507
7 246
5 627
5 451
5 416
4 606
4 247
2 943
2 061
2 001
1 316
858
550
425
9
Fonte
/
: Eurostat
Source
(b)
/
(e)
/
(p)
/
Quebra de série
Dado estimado
Dado provisório
Break in time series
Estimated
Provisional
(p)
-5,7
-4,7
-10
-5
0
5
10
15
20
25
España
2
Portugal
1
2004
2013
2012
2011
2010
2009
2008
2007
2006
2005
1
/
Dados estimados para 2013
2013:
Estimated
2
/
Dados provisórios 2013
2013:
Provisional
2020 2030 2040 2050
10,1
45,8
9,8
44,5
9,4
44,6
8,9
45,5
2060
2080
Milhões de habitantes
Million inhabitants
Portugal
España
Cenário principal
Main scenario
8,2
46,1
7,1
47,6
Projeções da população residente, 2020-2080
Population projections, 2020-2080
11
2070
7,6
46,5
População por NUTS II, 1 de janeiro de 2014
Population on 1 January 2014 (NUTS II)
Portugal
España
Andalucía
Cataluña
Comunidad de Madrid
Comunitat Valenciana
Galicia
Norte
Área Metropolitana de Lisboa
Centro
Alentejo
Algarve
Região Autónoma da Madeira
Região Autónoma dos Açores
Castilla y León
País Vasco
Canarias
Castilla- La Mancha
Región de Murcia
Aragón
Illes Balears
Principado de Asturias
Comunidad Foral de Navarra
Cantabria
La Rioja
Ceuta
Melilla
Extremadura
12
10 427,3
46 512,2
3644,2
2807,5
2281,2
743,3
442,4
261,3
247,4
8 388,9
7 416,2
6 378,3
4 956,4
2 747,2
2 495,7
2 167,2
2 114,8
2 075,2
1 461,8
1 331,3
1 115,8
1 096,4
1 059,0
636,5
587,7
315,2
84,7
83,9
Pirâmide etária, 1 de janeiro de 2014
/
Population pyramids, 1 January 2014
13
Fonte
/
: Eurostat
Source
Mulheres
Homens
Females
Males
5,0%
0,0%
5,0%
Portugal
España
Fonte
/
: Eurostat
Source
Fonte
/
: Eurostat
Source
(b)(e)
(b)
(p)
(e)(p)
(p)
Fonte
/
: Eurostat
Source
0-4
5-9
10-14
15-19
20-24
25-29
30-34
35-39
40-44
45-49
50-54
55-59
60-64
65-69
70-74
75-79
80-84
85
(e)
≥
Península Ibérica
The Iberian Peninsula
em números
2015
in figures
Índice
Index
por 1 000 hab./
.
per 1000 i
nhab
1 000 hab./inhab.