


 7 / 38

0
10
20
30
40
50
60
70
80
90
100
2004 2005 2006 2007 2008 2009 2010 2011 2012 2013
400
420
440
460
480
500
520
540
560
580
600
2006
2007
2008
2009
2010
2011
2012
2013
[07]
Territory and Environment
Território e Ambiente
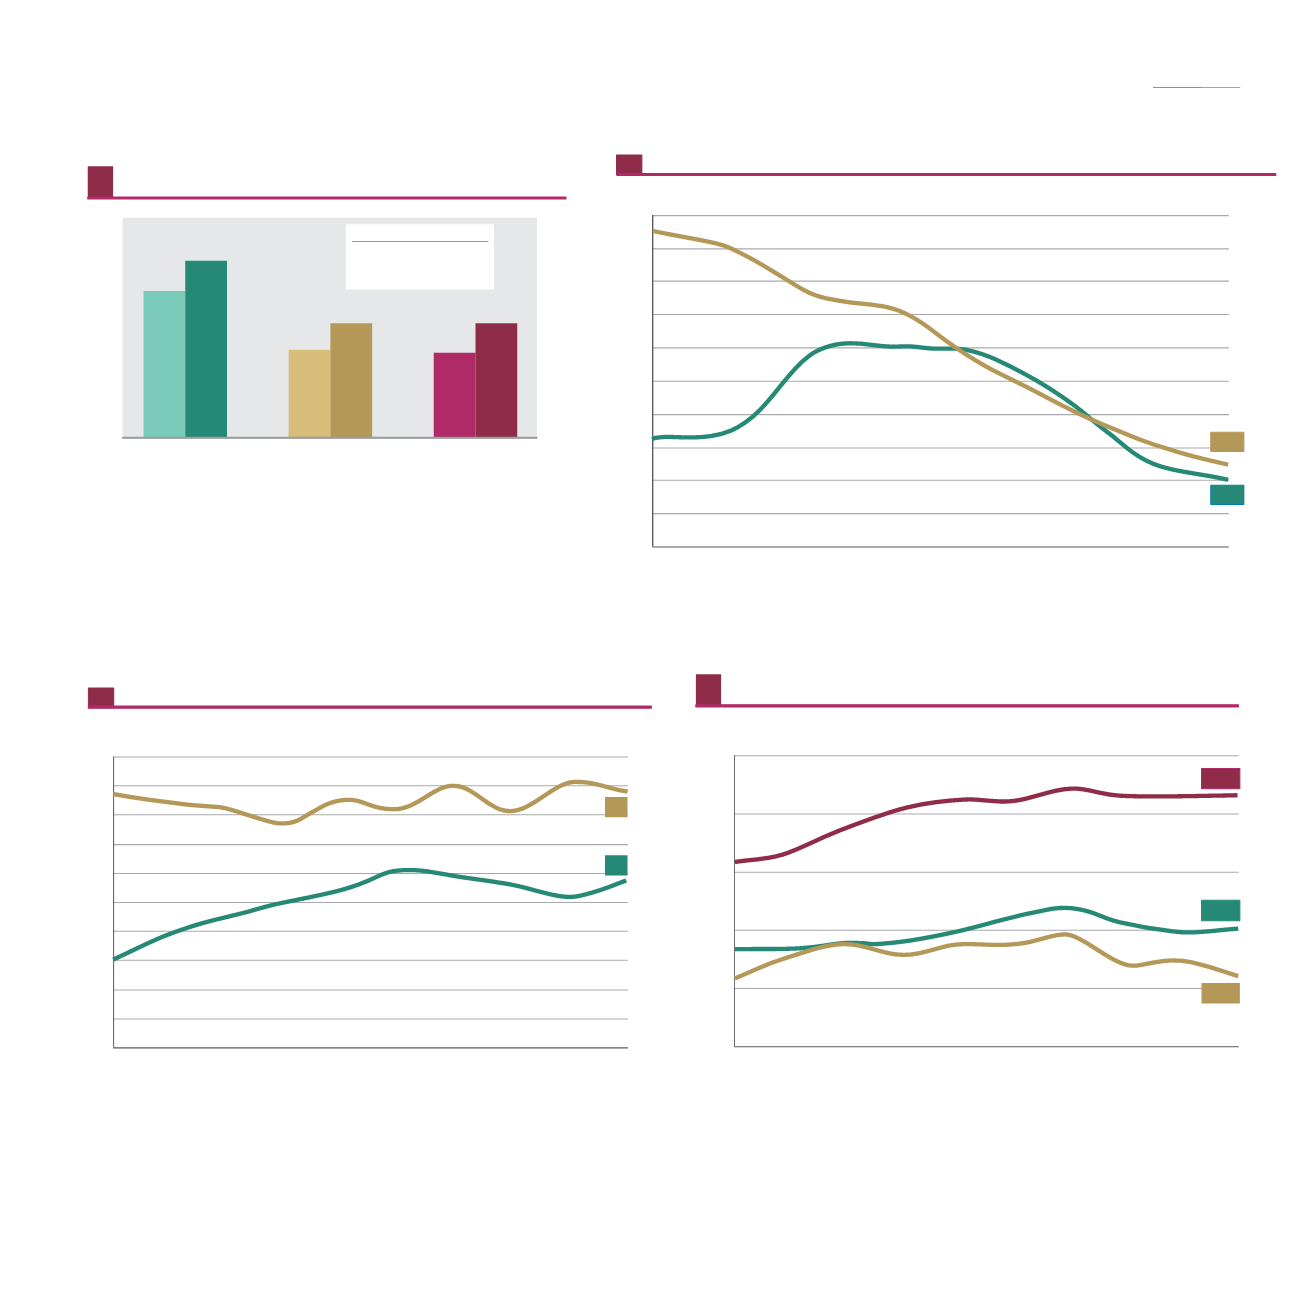
440
449
kg/hab.
kg./inhab.
España
2
Portugal
Resíduos urbanos recolhidos e tratados , 2006-2013
1
/
Municipal waste generation and treatment , 2006-2013
1
6
2
/
Dado estimado para 2013
2013: Estimated
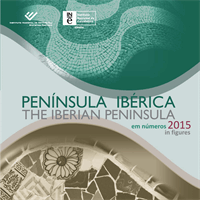
Contribuição das energias renováveis para o consumo final, 2013
Share of renewable energy in gross final energy consumption, 2013
Portugal
España
UE/ 28
EU
5
25,7%
15,4%
15,0%
Objective
Fonte
/
Source
: Eurostat
57
88
España
1
Portugal
Resíduos urbanos reciclados, 2004-2013
/
Municipal waste recycled, 2004-2013
7
1
Dado estimado para 2013
/
2013: Estimated
Fonte
/
Source
: Eurostat
Fonte
/
Source
: Eurostat
1
Todos ao resíduos urbanos recolhidos foram tratados
/
All the waste generated was treated.
0,0
40,0
80,0
120,0
160,0
200,0
2003 2004 2005 2006 2007 2008 2009 2010 2011 2012
€/hab.
€/inhab.
Despesa das Administrações Centrais em proteção ambiental, 2003-2012
Environmental protection expenditure by General government, 2003-2012
8
1
/
Dados estimados pelo Eurostat
Eurostat estimate
Fonte
/
: Eurostat
Source
49,1
España
Portugal
79,8
172,8
UE 28
1
Península Ibérica
The Iberian Peninsula
em números
2015
in figures
Objetivo
/
2020
Objective
Portugal
España
UE/ 28
EU
31%
20%
20%
Objetivo
Objective
Objetivo
Objective
Objetivo
Índice
Index
kg/hab.
kg./inhab.