


 8 / 59

6
/
PORTUGAL IN FIGURES
AMBIENTE
ENVIRONMENT
>
2014 Po
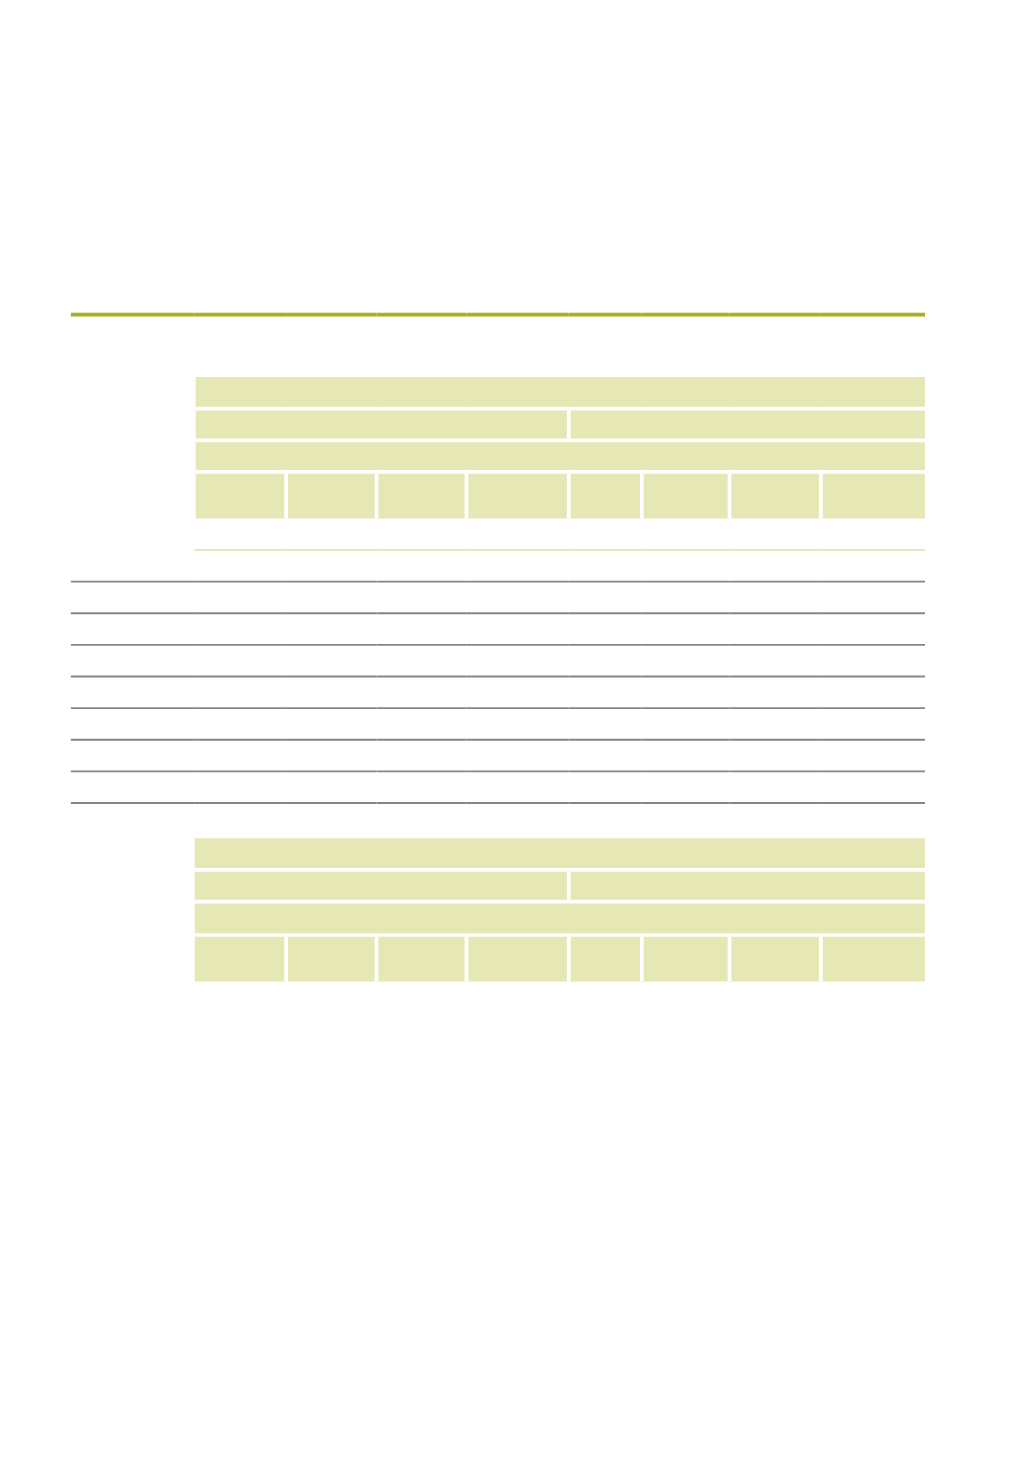
Resíduos urbanos recolhidos por tipo de recolha e tipo de destino
Urban waste collected by kind of collection and kind of destination
Tipo de recolha
Recolha indiferenciada
Recolha seletiva
Tipo de destino
Aterro Valorização
energética
Valorização
orgânica
Valorização
multimaterial
Aterro Valorização
energética
Valorização
orgânica
Valorização
multimaterial
t
Portugal
2 288 924 965 723 584 460
232 979 18 248
7 923
80 514
531 694
Continente
2 183 558 871 512 576 599
232 129 18 018
0
80 514
510 938
Norte
792 506 320 345 165 667
13 641 5 554
0
39 815
190 361
Centro
455 006
9 706 296 248
85 039 7 467
0
447
79 982
A. M. Lisboa 428 400 539 279
88 117
81 072
0
0
26 225
141 771
Alentejo
249 278
2 182
26 567
52 031 1 439
0
137
37 510
Algarve
258 369
0
0
346 3 558
0
13 890
61 314
R. A. Açores
104 273
0
7 861
850
0
0
0
12 949
R. A. Madeira
1 093
94 211
0
0
230
7 923
0
7 807
Type of collection
Indistinct collection
Selective collection
Kind of destination
Landfill
Energy
recovery
Organic
recycling
Multimaterial
recovery
Landfill
Energy
recovery
Organic
recycling
Multimaterial
recovery
Fonte/
Source
INE, I.P., Estatísticas dos resíduos municipais.
Statistics Portugal, Municipal waste statistics.
A proporção de resíduos remetidos
para
valorização orgânica
registou uma
subida
de
6,8 p.p
. em igual período (2010-2014),
passando de
7,3% para 14,1%
do total de
resíduos recolhidos.
The share of waste for organic recycling
increased by 6,8 p.p. in the 2010-2014 period,
from 7.3% to 14.1% of total waste collected.