


 14 / 59

12
/
PORTUGAL IN FIGURES
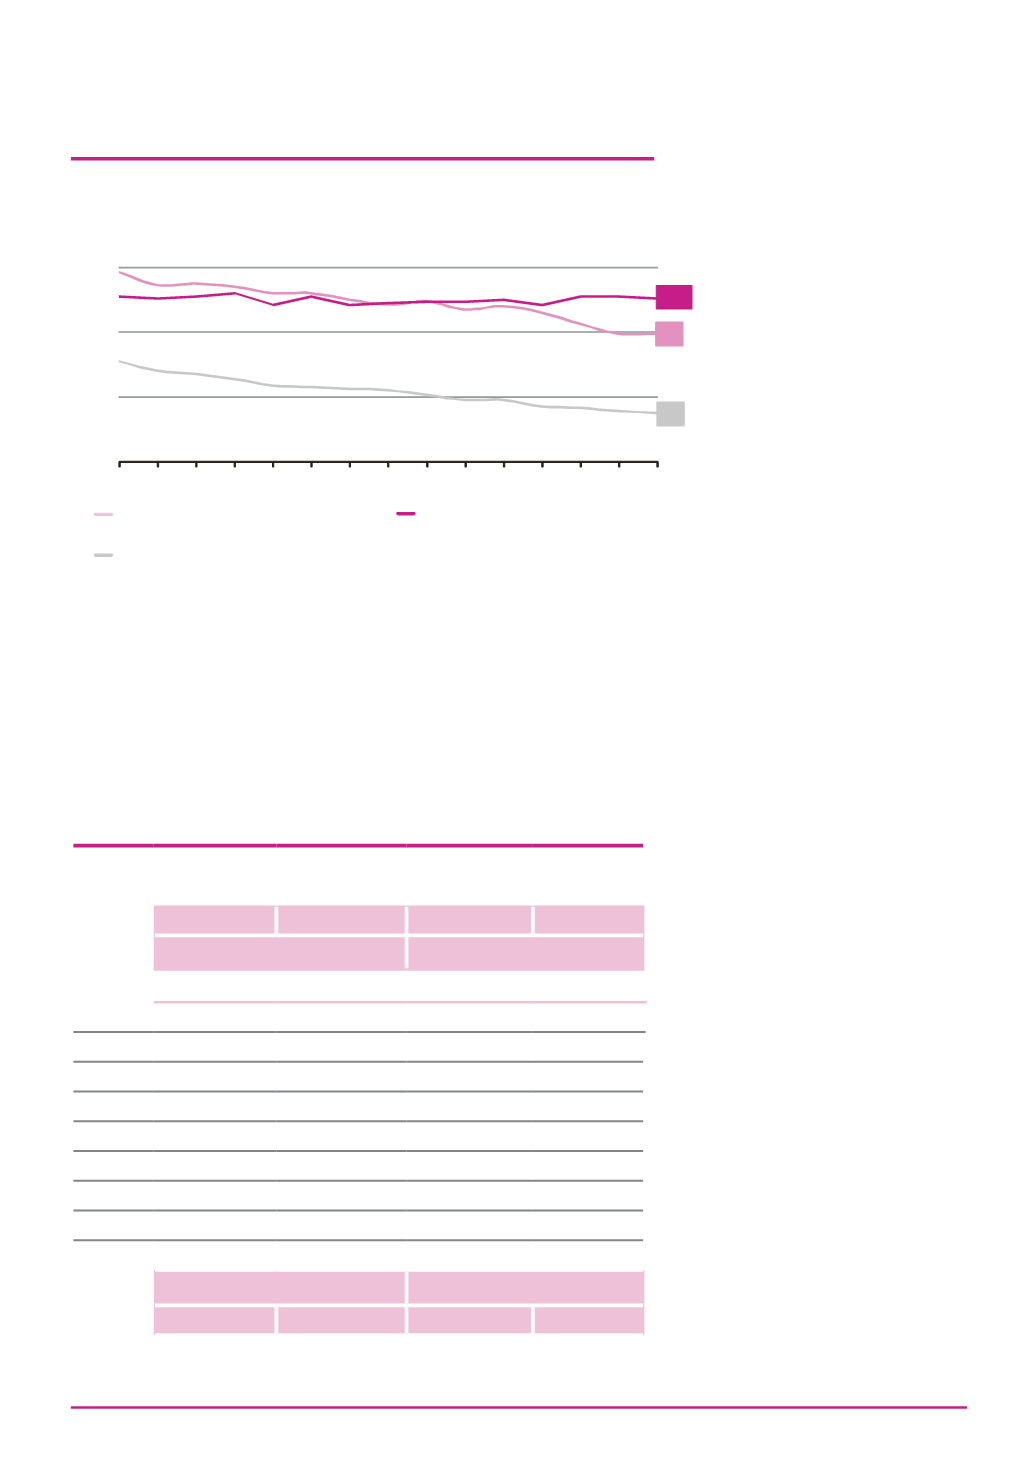
Esperança de vida
Life expectancy
Homens
Mulheres
Homens
Mulheres
Esperança de vida à nascença
Esperança de vida aos 65 anos
Ano
/
Year
2004 - 2006
74,81
81,33
16,02
19,42
2005 - 2007
75,18
81,63
16,16
19,55
2006 - 2008
75,49
81,81
16,35
19,70
2007 - 2009
75,84
81,87
16,48
19,74
2008 - 2010
76,17
82,19
16,74
20,03
2009 - 2011
76,47
82,43
16,92
20,20
2010 - 2012
76,67
82,59
16,94
20,27
2011 -2013
76,91
82,79
17,07
20,40
2012 - 2014
77,16
83,03
17,23
20,55
Life expectancy at birth
Life expectancy at 65 years
Males
Females
Males
Females
Fonte/
Source
INE, I.P, Tábuas Completas de Mortalidade.
Statistics Portugal, Complete life tables.
Indicadores de População
Population indicators
Fonte/
Source
INE, I.P., Estimativas Definitivas da População Residente e Estimativas Provisórias da
População Residente.
Statistics Portugal,Final Resident Population Estimates and Provisional Estimates of Resident
Population.
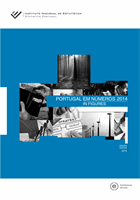
Taxa bruta de natalidade
Crude birth rate
Taxa bruta de mortalidade
Crude death rate
Taxa bruta de nupcialidade
Crude marriage rate
7,9
10,1
3,0
0
4
8
12
2000 01 02 03 04 05 06 07 08 09 10 11 12 13 2014
‰
Em
2014
celebram-se
31 478
casamentos
em
Portugal,
dos quais do
31 170
entre pessoas do
sexo oposto e
308
entre pessoas do
mesmo sexo.
In 2014 there were 31,478
marriages in Portugal, of
which 31,170 were opposite-sex
marriages and 308
were same-sex marriages.