


 32 / 48

30 \
Área Metropolitana de
Lisboa - ECONOMIC ACTIVITY
2015
2015
2015
Indicadores de transportes
Transport indicators
Infraestrutura ferroviária e fluxos de transporte
Railway infra-structure and transport flows
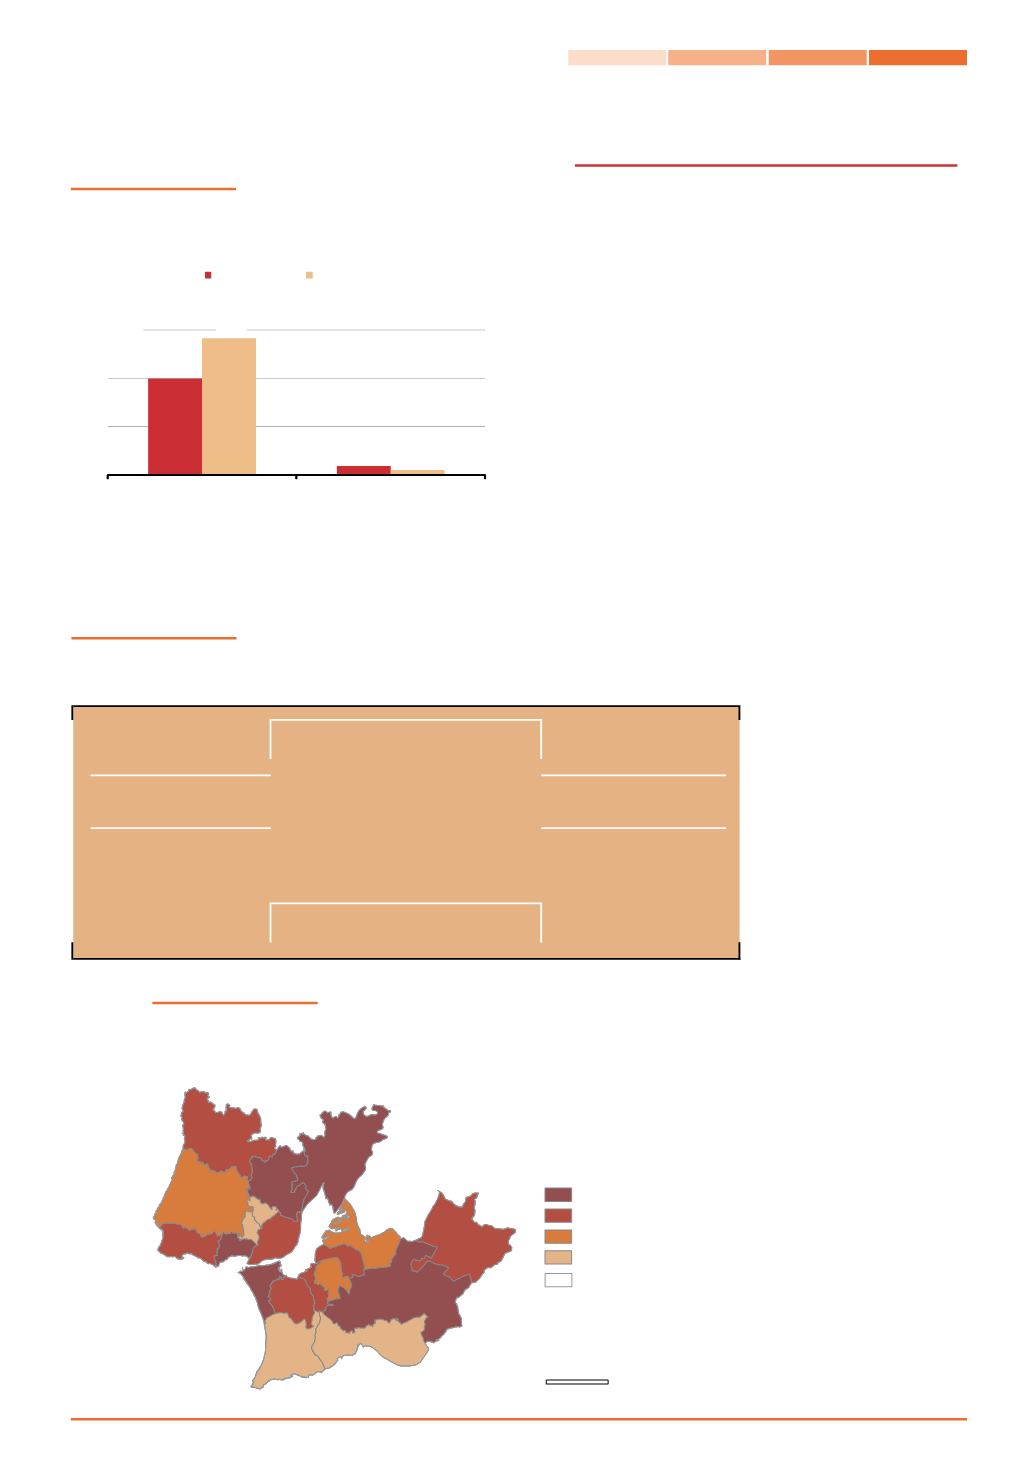
Proporção de acidentes de viação com vítimas nas autoestradas, por município
Proportion of road accidents with victims on highways, by municipality
III.9 Transportes
Transport
Fonte
: Instituto dos Registos e do Notariado, I. P.; INE,
I.P.; Autoridade Nacional de Segurança Rodoviária
(ANSR).
Source
: Institute of Registries and Notaries; Statistics
Portugal; National Authority for Road Safety.
Nota: Os acidentes e as vítimas são afetados aos
municípios segundo o local do acidente.
Note: Road accidents and victims by region according
to the place of the accident.
Fonte
: Autoridade Nacional
de Segurança Rodoviária
(ANSR).
Source
: National Authority
for Road Safety.
Nota: Os acidentes e as
vítimas são afetados aos
municípios segundo o local
do acidente.
Note: Road accidents and
victims are attributed to
municipalities according to
the place of accident.
Fonte
: INE, I.P., Inquérito à
infraestrutura ferroviária.
Source
: Statistics Portugal,
Rail infra-structure survey.
2015
A. M. Lisboa Continente
A. M. Lisboa /
Continente (%)
2015
Km
Km
Extensão das linhas e vias
exploradas
274
2 546
10,8
Line extensions and explored
railways
Milhares
Thousands
Passageiras/os transportados
Passengers carried
Por região de origem
96 316
74,0
By region of origin
Por região de destino
96 321
74,0
By region of destination
A. M. Lisboa Mainland
A. M. Lisboa /
Mainland (%)
130 194
´
0
15 km
NUTS II
%
] 8 ; 20 ]
] 3 ; 8 ]
] 1 ; 3 ]
[ 0 ; 1 ]
Continente
A. M. Lisboa
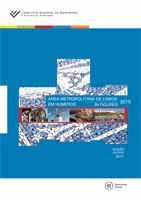
Veículos automóveis novos
vendidos e registados por
1 000 habitantes
New vehicles sold and
registered per 1000
inhabitants
Índice de gravidade dos
acidentes de viação com
vítimas
Gravity index of road
accidents with victims
N.º
No.
28,3
1,0
0
10
20
30