


 21 / 48

2014 e/
and
2015 Pe
Indicadores de contas regionais
Regional accounts indicators
A. M. Lisboa Portugal
A. M. Lisboa /
Portugal
%
2015 Pe
2015 Pe
PIB 65 344 179 540
36,4
GDP
VAB 56 992 156 612
36,4
GVA
2014
2014
Remunerações 29 603
76 472
38,7
Compensation of
employees
RDB das famílias 38 773 116 747
33,2
Households GDI
FBCF 8 635
25 993
33,2
GFCF
%
A. M. Lisboa Portugal
A. M. Lisboa /
Portugal
milhões de euros
million euros
Fonte
: INE, I.P.,
Contas regionais
(Base 2011).
Source
: Statistics
Portugal, Regional
accounts (Base 2011).
Nota: Pe- Valor
preliminar.
Note: Pe- Preliminary
value.
Fonte
: INE, I.P., Contas regionais
(Base 2011).
Source
: Statistics Portugal, Regional
accounts (Base 2011).
Nota: Pe- Valor preliminar.
Note: Pe- Preliminary value.
2015 Pe
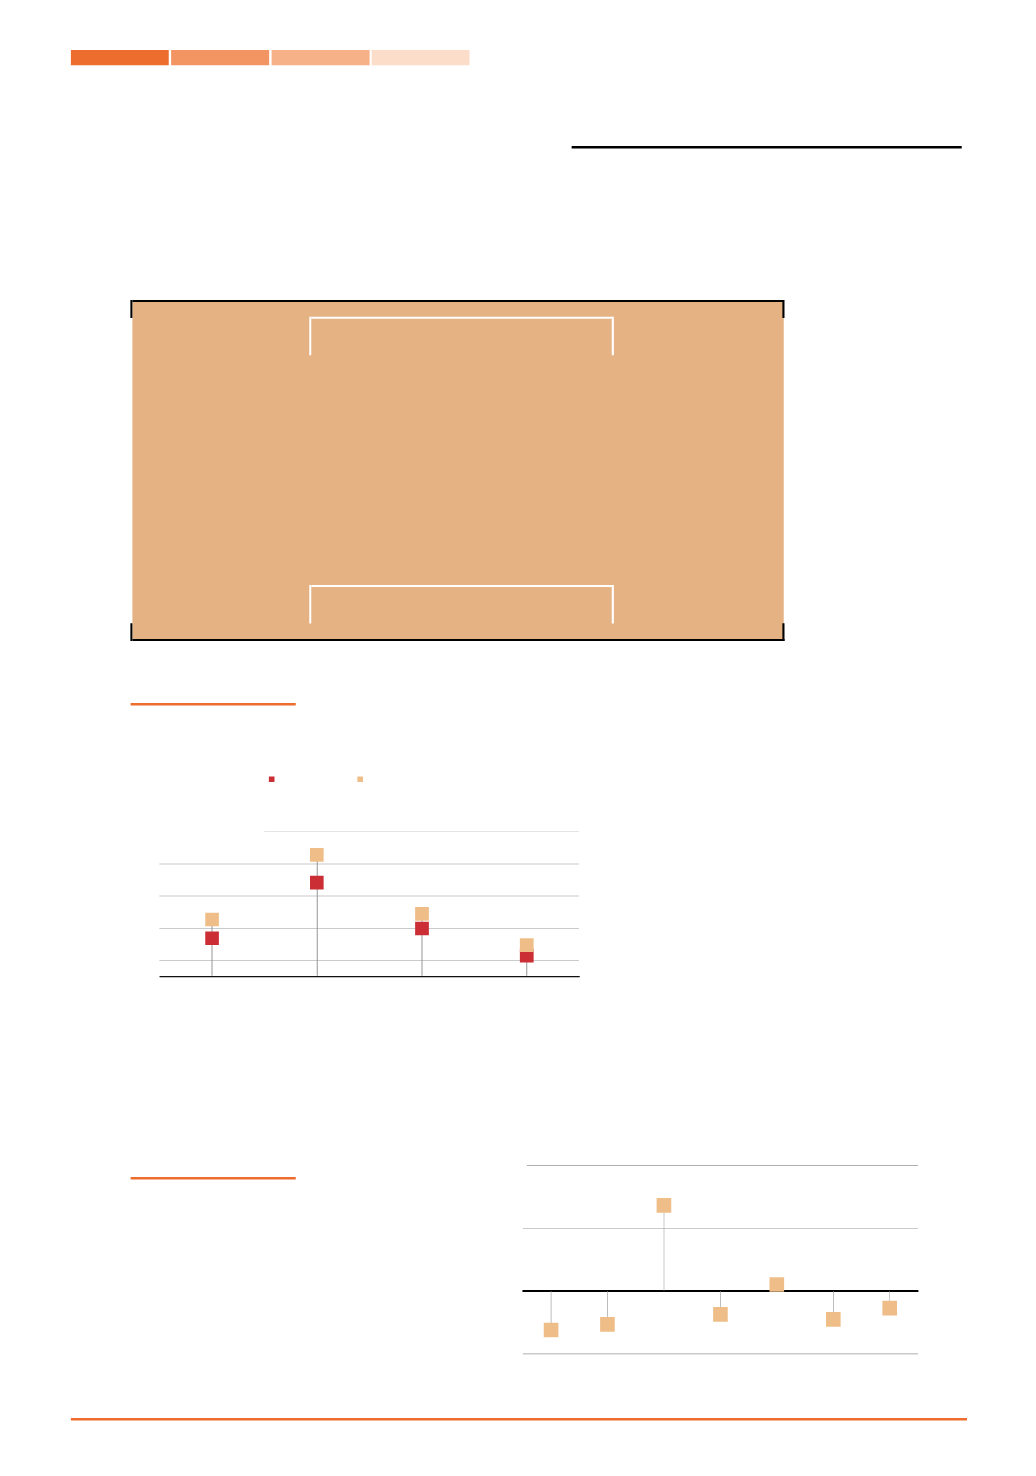
Índice de disparidade do PIB
per capita (Portugal=100)
GDP per capita disparity index
(Portugal=100)
Fonte
: INE, I.P., Contas regionais (Base 2011).
Source
: Statistics Portugal,
Regional accounts (Base 2011).
Nota: Pe- Valor preliminar.
Note: Pe- Preliminary value.
III.1 Contas Regionais
Regional Accounts
A ATIVIDADE ECONÓMICA/
ECONOMIC ACTIVITY
23
43
25
14
0
10
20
30
40
50
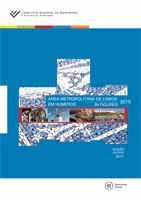
PIB per capita
GDP per capita
(2015 Pe)
Produtividade
aparente do
trabalho (VAB/
Emprego)
Apparent labour
productivity (GVA/
Employment)
(2015 Pe)
Remuneração
média
Average
compensation
of employees
(2014)
RDB das
famílias
per capita
Households
GDI per
capita
(2014)
Portugal
A. M. Lisboa
milhares de euros
thousand euros
84,5 86,7
134,1
90,7
102,6
88,7
93,2
75
100
125
150
Norte Centro A. M.
Lisboa
Alentejo Algarve R. A.
Açores
R. A.
Madeira
%