


 5 / 35

AS PESSOAS \
3
População residente em 31/12/2014 segundo o sexo por
NUTS II
Resident Population on 31/12/2014 according to sex by
region
Fonte/
Source
INE, I.P., Estatísticas Demográficas, Estimativas Provisórias de
População Residente
Statistics Portugal - Demographic Statistics, Provisional Estimates of
Resident Population
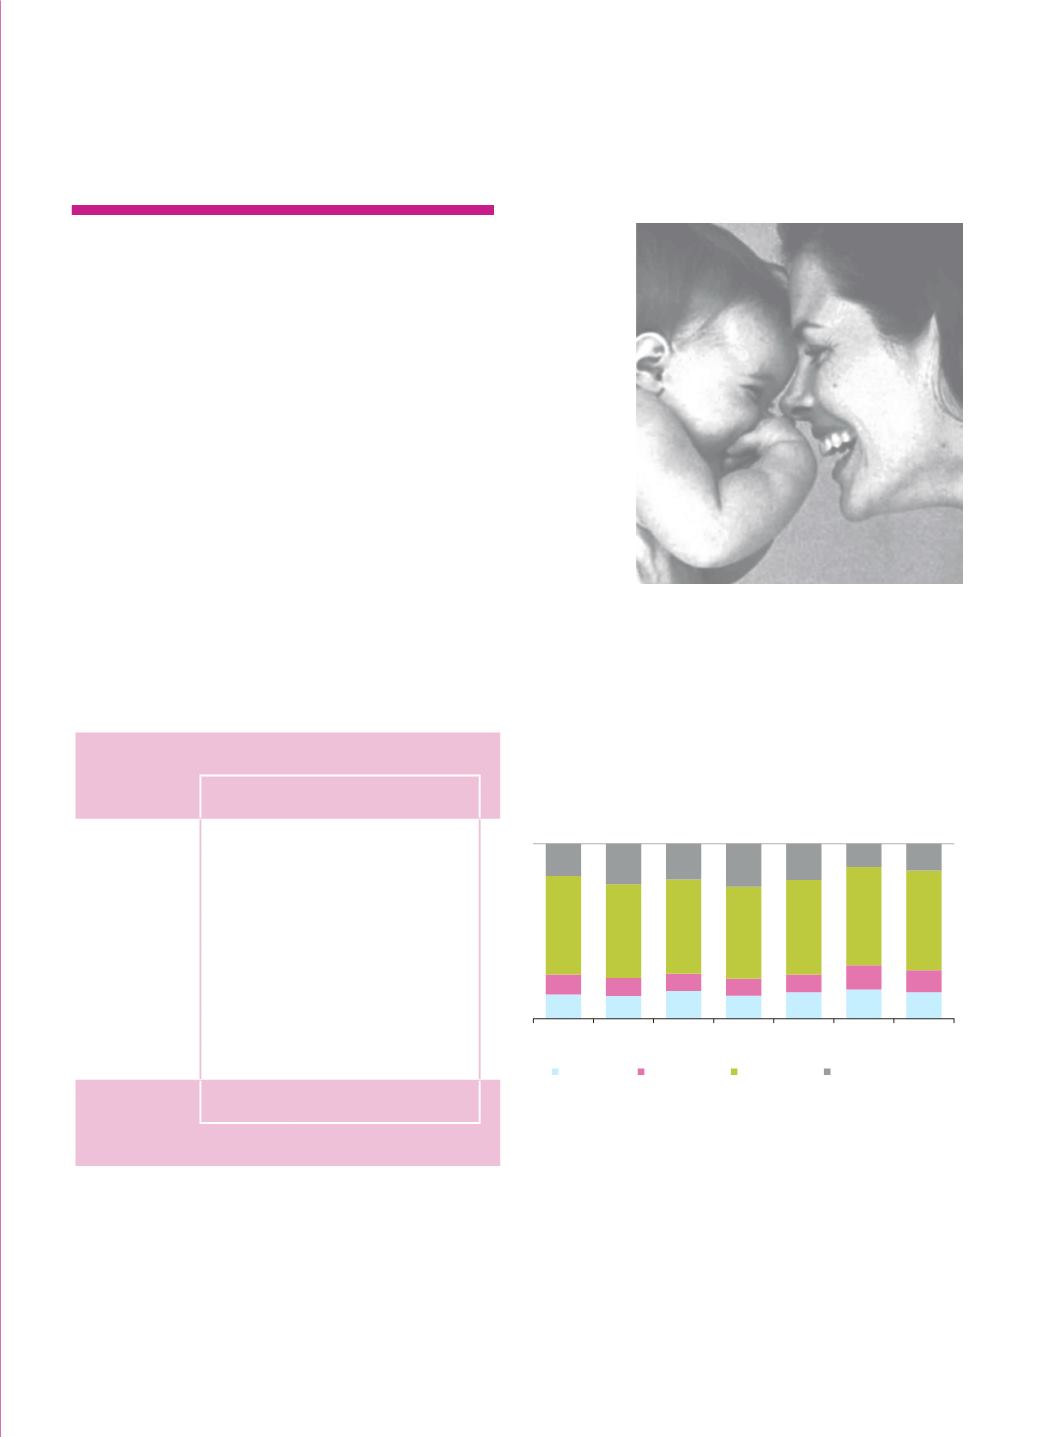
Distribuição percentual da população residente
segundo o grupo etário, em 31/12/2014 por NUTS II
Percent distribution of resident population according
to age groups, on 31/12/2014, by region
Fonte/
Source
INE, I.P., Estatísticas Demográficas, Estimativas Provisórias de População
Residente
Statistics Portugal - Demographic Statistics, Provisional Estimates of
Resident Population
Nº
Total
Homens
Mulheres
Portugal
10 374 822 4 923 666 5 451 156
Norte
3 621 785 1 720 635 1 901 150
Centro
2 263 992 1 073 816 1 190 176
A.M. Lisboa
2 809 168 1 321 402 1 487 766
Alentejo
733 370 353 231 380 139
Algarve
441 468 212 756 228 712
R. A. Açores
246 353 120 758 125 595
R. A. Madeira
258 686 121 068 137 618
Total
Males
Females
No.
AS PESSOAS
PEOPLE
POPULAÇÃO
POPULATION
>
14%
13%
16%
13%
15%
17%
15%
11%
10%
10%
10%
10%
14%
13%
56%
54%
54%
53%
54%
56%
57%
18%
23%
20%
24%
21%
13%
15%
Norte
Centro
A. M.
Lisboa
Alentejo Algarve
R. A.
Açores
R. A.
Madeira
0-14 anos
0-14 years
15-24 anos
15-24 years
25-64 anos
25-64 years
65 e+ anos
65 years and over