


 8 / 58

6
/
PORTUGAL IN FIGURES
AMBIENTE
ENVIRONMENT
>
2012
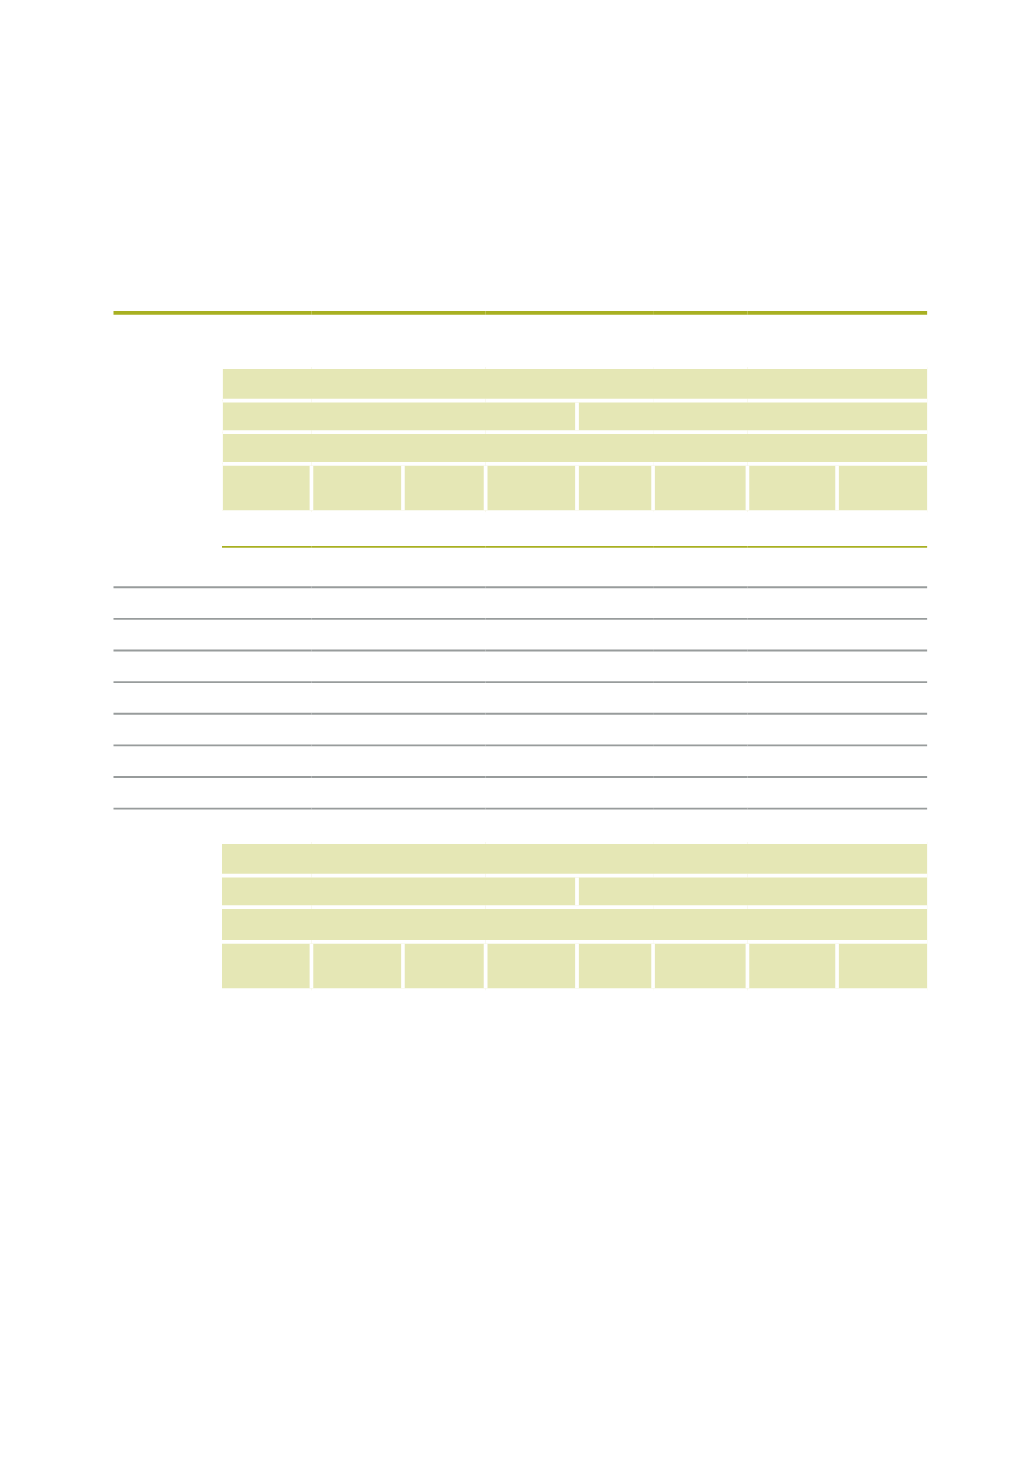
Resíduos urbanos recolhidos por tipo de recolha e tipo de destino
Urban waste collected by kind of collection and kind of destination
Tipo de recolha
Recolha indiferenciada
Recolha seletiva
Tipo de destino
Aterro
Valorização
energética
Valorização
orgânica
Valorização
multimaterial
Aterro
Valorização
energética
Valorização
orgânica
Valorização
multimaterial
t
Portugal
2 537 511 921 717 606 730
34 493 55 286
8 091
87 103 514 992
Continente 2 428 006 823 526 602 322
34 493 55 002
607
87 103 495 389
Norte
847 021 370 859 96 433
395 4 908
607
39 089 161 606
Centro 579 395
26 801 216 032
8 636 10 411
0
500
78 686
Lisboa
458 169 422 039 248 720
21 649
212
0
31 308 193 045
Alentejo 284 928
3 828 41 136
3 813 5 853
0
33
32 244
Algarve 258 494
0
0
0 33 619
0
16 173
29 809
R. A. Açores
108 109
0
4 408
0
0
0
0
10 914
R. A. Madeira 1 395
98 191
0
0
284
7 484
0
8 689
Type of collection
Indistinct collection
Selective collection
Kind of destination
Landfill
Energy
recovery
Organic
recycling
Multimaterial
recovery
Landfill
Energy
recovery
Organic
recycling
Multimaterial
recovery
Fonte/
Source
INE, I.P., Estatísticas dos resíduos municipais.
Statistics Portugal, Municipal waste statistics.
A proporção de resíduos remetidos
para
valorização orgânica
registou uma
subida
de
7 p.p
. no período 2008-2012,
passando de
7,0% para
14,6%
do total de
resíduos recolhidos.
The share of waste for organic recycling
increased by 7 p.p. in the 2008-12 period, from
7.0% to 14.6% of total waste collected.